A Comparison of A36 Steel and Various Weld Metal Fatigue Test Results
Author: A. Conle, U. Waterloo
Web Page: https://fde.uwaterloo.ca/Fde/Material/Steel/Weldmetal/compareWeldMetal.html
Updates: Dec2015
Copyright (C) 2015 Fatigue Design + Evaluation Comm.
Permission is granted to copy, distribute and/or modify this document
under the terms of the GNU Free Documentation License, Version 1.3
or any later version published by the Free Software Foundation;
with no Invariant Sections, no Front-Cover Texts, and no Back-Cover Texts.
A copy of the license is available here:
"GNU Free Documentation License". ( "http://www.gnu.org/licenses/fdl.html" )
Introduction:
R.C. Leever in 1980 proposed to the F.D.+E. Comm. a process for using
measurements of "hot-spot" strains, near a steel weld, as an input variable
for fatigue life calculations.
-
R.C.Leever's original presentation to FD+E Oct. 1980
also published in paper: R.C.Leever, "Application of Life Prediction
Methods to As-Welded Steel Structures," ASME Int. Conf. on Advances in Life
Prediction Methods, The Matls. Conf, Albany, NY, Apr. 18-20, 1983.
Lib. of Congress 83-70330.
The hot-spot strains of a given load history were damage summed using uniaxial
smooth coupon specimen data as the base line fatigue curve with application of a
Neuber Plasticity Correction method and a stress concentration factor Kt=2.
Leever also suggested that the effects of mean stress could be ignored, and that
the method was limited to materials whose base metal yield stress fell below 100ksi.
The present web page explores Leever's proposal by simply comparing the test
results on un-notched axial specimens cut from weld metal with the results from
tests performed using ASTM A36 steel; a lower carbon basic structural steel.
The weld metal raw fatigue test files used for the comparison can be found on
the web page:
https://fde.uwaterloo.ca/Fde/Materials/Steel/Weldmetal/steelWeldMetal.html
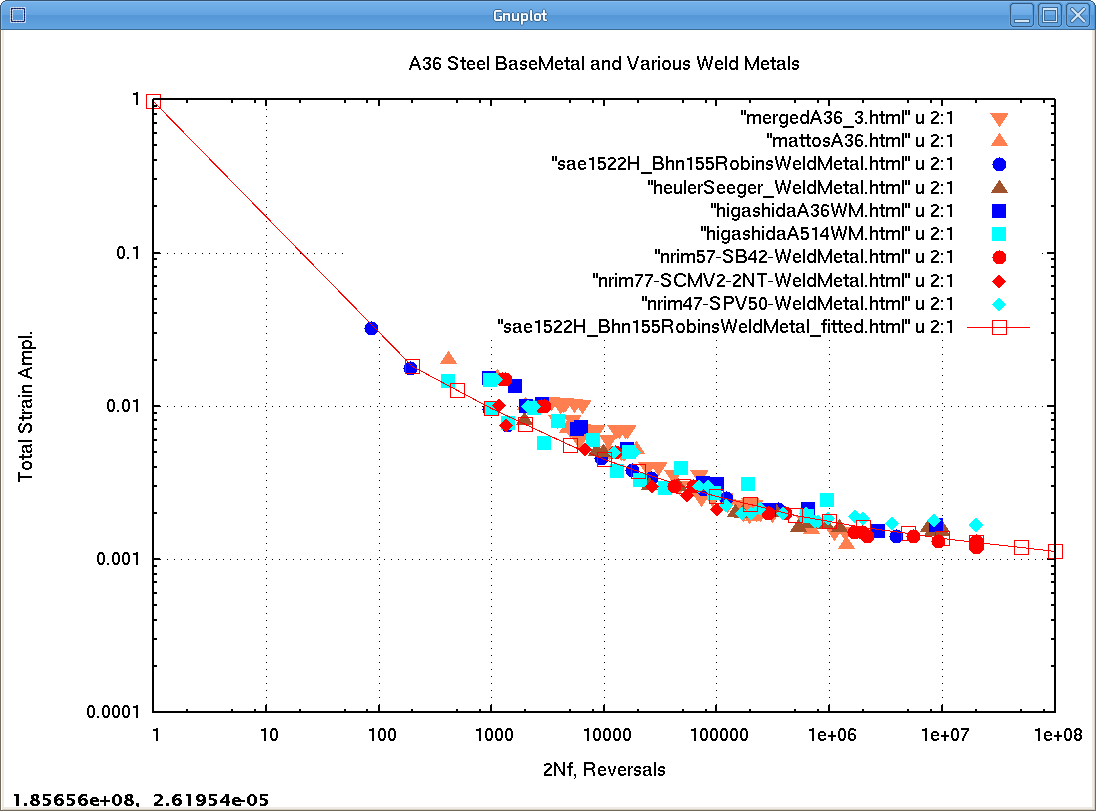
Total Strain Amplitude vs. 2Nf:
Most of the tests were performed in strain control using deflection
measuring extensometers and servo-hydraulic feedback control. Some
tests (NRIM) used both axial and diametral extensometers and some tests
were done in load control with observed strain response.
Figure 1 depicts the strain-life results. One of the available data
sets by Vanderzanden has been eliminated because all the specimens
were cyclically pre-strained before testing, a process which significantly
decreases fatigue life.
Included in the plot are the Higashida test results which are for
a base metal with a yield strength Sy = 796 mpa (115 ksi), which is outside
of the range of applicability suggested by Leever.
 ( Click figure to enlarge )
Fig. 1:Total strain amplitude vs life data for weld metal tests
and A36 base metal fatigue tests.
The test results for the various weld metals all merge into a
reasonably compact curve typical of results from merged test data files
of single steels from different heats or test labs. ( See:
Scatter in Fatigue data )
Surprisingly the high strength Higashida data also fits within the overall
scatter band.
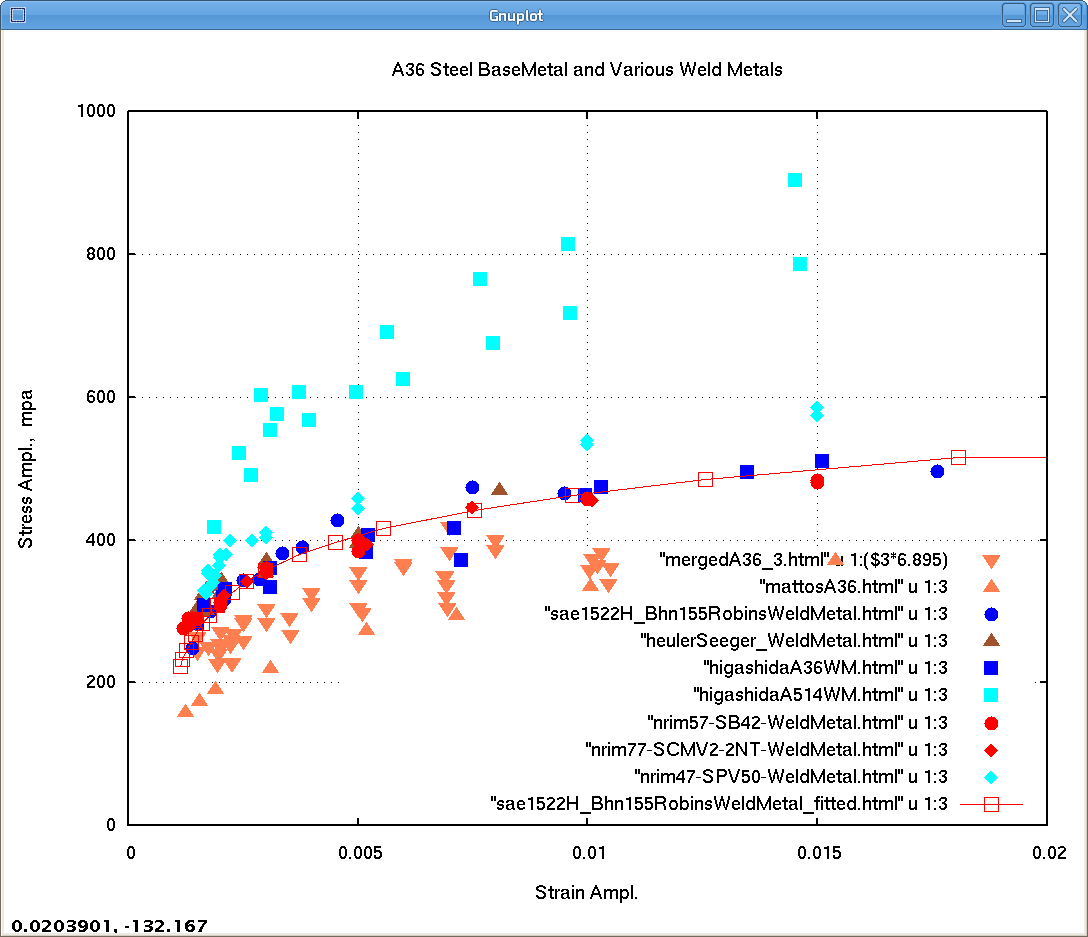
Cyclic Stress-Strain Curve Comparison:
When tests are done in constant strain amplitude control the stress amplitude
often changes as the material cyclically hardens or softens. Experience has
shown that the most "representative" stress amplitude for each test can be
measured from a stress-strain hysteresis loop observed at half of the fatigue life.
A similar process was employed by the NRIM investigations, some of which were
done in load control for comparison, by observing the strain amplitude at half life.
Generally a plot of half-life stresses and strains shows considerable
more scatter than in strain amplitude vs. life plots. Figure 2
 ( Click figure to enlarge )
Fig. 2:Cyclic Stress-Strain data for weld metal tests
and A36 base metal fatigue tests.
Aside from the wider scatter of the data points the higher strength weld metal
of Higashida stands out well above the other results. The cyclic stress-strain
curve is used in Neuber plasticity correction computations (see above link) to
compute the local stress and strain response of notched components or finite
element results that use elastic analysis. It would appear that analysis for such
higher strength welded components would not be possible using averaged cyclic
stress-strain curves such as the fitted curve shown in Fig. 2.
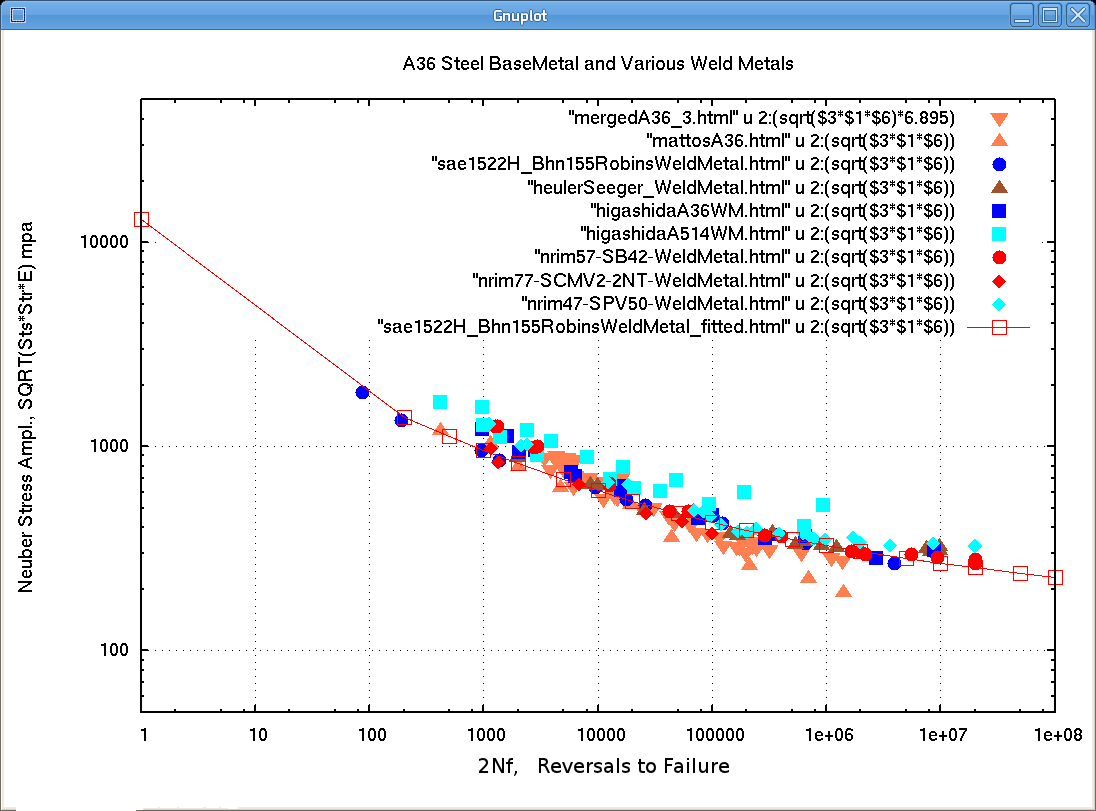
Neuber Equivalent Stress Amplitude Comparison:
A Neuber Equivalent Stress vs Life plot incorporates stress-strain energy
in the Y-axis variable. Specimens with wholly elastic stress-strain hysteresis
loops and specimens with plasticity in their loops are both plotted such that
the Y-axis, although with stress units, actually represents the energy resisted
by a given stress-strain hysteresis loop. The Y-axis of Fig. 3 automatically
transforms an elastically computed stress amplitude (including stresses above
the yield) into the equivalent energy plasticity corrected hot-spot hysteresis
loop. One can enter the Y-axis with the computed elastic stress amplitude of
an element from a finite element model of a structure and compute fatigue life
at the center of the scatter band. (There is however no mean stress correction)
 ( Click figure to enlarge )
Fig. 3:Neuber Equivalent Stress vs Life data for weld metal tests
and A36 base metal fatigue tests.
As one would expect from the equivalent stress formulation the
Higashida weld metal results, that where considerably higher than the lower
strength material data in Fig. 2, also does not fit the general trend.
Similarly some of the A36 base metal test results fall slightly lower at long
life. The "Fitted" curve, estimated from the tests of Robins, can also be
considered slightly non-conservative, but this could be corrected by slightly
reducing the 2Nf values of the fitted data file.
Summary:
It appears that Leever's original premise is valid: Fatigue specimens
cut from various low and medium strength steel weld metals exhibit fatigue
lives similar to that of A36 steel base metal. This result would lead to
the conclusion that one can use the A36 steel fatigue results and using
a Neuber plasticity correction to express the effects of weld geometry
with an appropriate Stress Concentration Factor compute fatigue life to
crack initiation at the weld line. "Good" welds are
typically about Kt=2. (See
the "F.D.E Total Life Project 1" on the link page.
Other links to FDE Weld pages:
Materials Index
 ( Click figure to enlarge )