In the ground vehicle industry much of the local stress analysis is
done using elastic finite element (or simple stress*Kt) type calculations.
These elastic stresses are then transformed into local stresses and strains
using some form of Plasticity correction tool which requires a definition
of the cyclic stress-strain curve along with the fatigue life curve.
The analysis method proposed here allows this type of correction to be
made for aluminum weld data sets, and thus will conform to the standard
methods presently applied in the ground vehicle industry.

Aluminum AA6061 was selected as the base metal starting point for a
Leever[22] type model of fatigue of aluminum welds. Although there is quite
a bit of information available for base metal AA6061 fatigue curves, not
a great deal of it has been made public. After the creation of the
SAE J1099 database, an event which in my opinion gave a major impetus to
fatigue analysis in the ground vehicle industry, most of the original
contributing corporations "clammed up" and kept further testing to themselves.
In my opinion this lack of openness is generally harmful to all
concerned. My commendations to NRIM (National Res. Inst. for Metals) in
Tokyo, Japan for continuing to "do the right thing" for engineering.
Thus far I have only found two public sets of AA_6061 stress-strain-life
fatigue results:
[1] R.F.Brodrick, G.A.Spiering, "Low Cycle Fatigue of Aluminum Alloys",
ASTM J.of Matls, V7 N4 Dec 1972, pp.515-526
[2] Y.S. Chung, A.Abel, "Low Cycle Fatigue of Some Aluminum Alloys,"
ASTM STP 942 1988, pg. 94-106. also available in book by
A.Bäumel Jr and T.Seeger, "Materials Data for Cyclic Loading,"
Supplement 1, Elsevier, 1990.
The data sets are also available in the following location:
https://fde.uwaterloo.ca/Fde/Materials/Alum/AA6xxx/aa6xxx.html
Unfortunately they do not have any results beyond about 50000 reversals to
failure. In order to obtain stress-strain and fatigue curves for longer
lives it was necessary to use the Neuber plot from the paper:
[3] F.A.Conle and J.J.F.Bonnen, "Using the Neuber Plot to Account for the
Effects of Scatter, Corrosion and Welding in Strain-Life Fatigue Test Data,"
2008 ISOPE Conf. Vancouver BC, July 10.
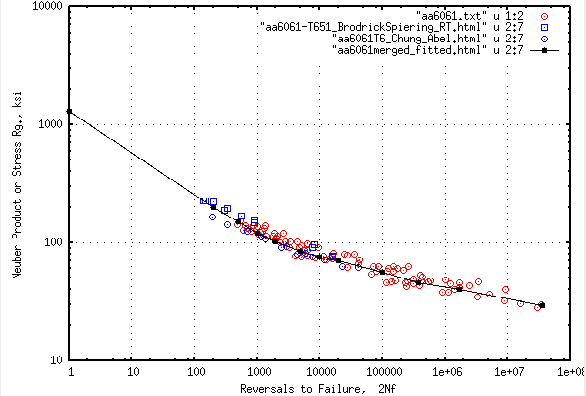
Neuber Stress = SQRT(StressRange * StrainRange* Modulus ) is depicted
versus fatigue life in a combined plot of data from [1],[2], and [3].
By using the elastic behavior of aluminum at longer fatigue lives it was
possible to add the long life information to a merged "Fitted" file
available here:
See: AA 6061- Merged Room Temp data files __ | __ Fitted __ | __ Calculator
The fitted curve points and the data from the three references are
depicted in the Neuber plot:
Click image to enlarge
The fitted curve, or one like it, will form the material "base line"
curve for the Leever method applied to welded aluminum components.
After scanning a typical aluminum weld fatigue curve figure and digitizing
the data one must compensate somehow for the effects of tests run under
different load ratios, in order to plot the data on a combined Neuber type
plot. Thus far I have found that using:
SequivAmpl = SQRT( Smax * Sa )
where SequivAmpl is an equivalent constant R=-1 stress amplitude, Smax
is the maximum stress in the test cycle, and Sa is the stress amplitude of
the test cycle. It is a form of the Smith-Watson-Topper mean stress
correction factor and should work reasonably well under primarily elastic
conditions, which these aluminum weldment tests appear to have.
In some of the graphs below I have not yet deleted the regions of the test
results where one would expect substantial plasticity; typically lives shorter
than 10**4 cycles. I have also left in Sanders' AA3003 data curve but have
not yet obtained the original reference work. Also still missing are
2000 series alloy results. The first three graphs are provided to show the
evolution of the results as more curves are added to the plot.
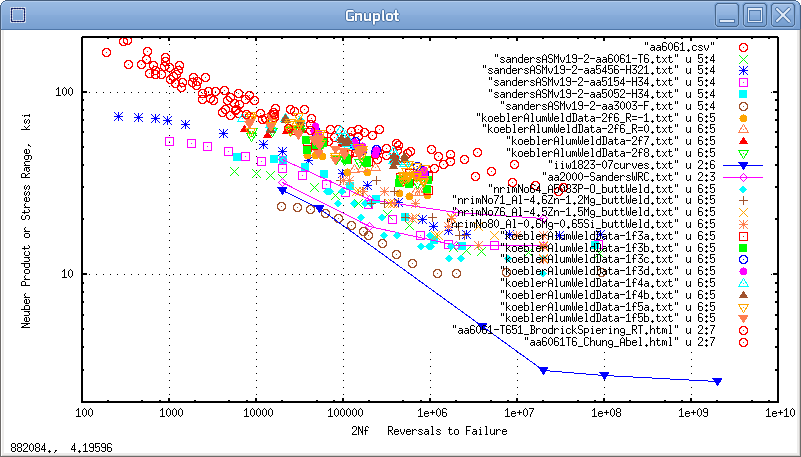
Finally, all of above data accumulated to date are plotted here:
Click image to enlarge
Figure: Neuber plot of aluminum weld data along with un-notched AA_6061
base line data. Also included is a stress-life plot of the IIW1823 weld curve.
Given the porosity found in many weldments, it was thought to be of
interest to compare the fatigue behavior of a typical cast aluminum,
in this case a 319 engine material. The baseline data for both simple
constant amplitude strain control tests and periodic overload tests
can be found
here.
A summary figure for cast 319 aluminum is shown in the following graph.
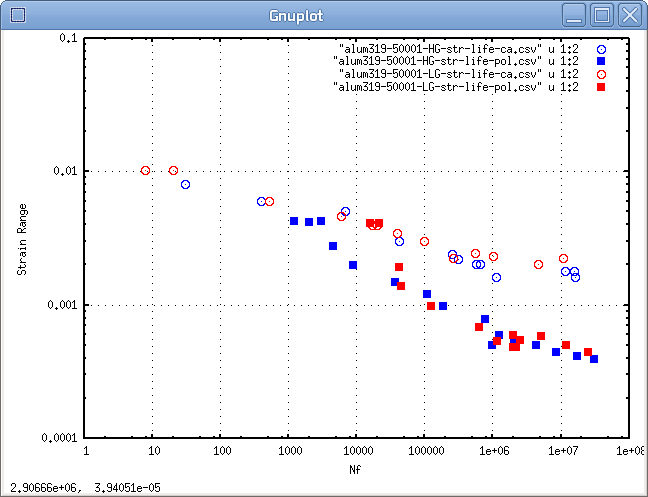
Figure: Strain life comparison plot of Constant Amplitude and Periodic
Overstrained fatigue test results of 319 Cast Aluminum.
With the added consideration of half life cyclic stresses and elastic modulus
the test data of the above plot can be added to the aluminum weld Neuber Stress
plots shown previously.
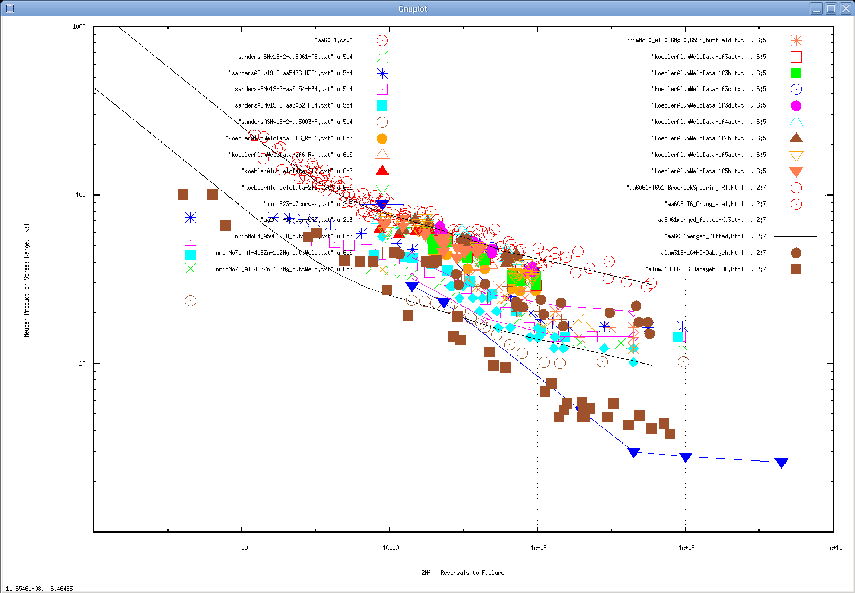
(Click image to enlarge)
Figure: Neuber plot of aluminum weld data, AA_6061 constant amplitude
data, IIW1823 weld curve, and Cast 319 aluminum.
In the above figure the filled brown circles are for 319 constant amplitude
tests and filled square points are 319 periodic overstrain test results.
One can conclude that this particular cast aluminum is very similar to weld
aluminum fatigue data and that the IIW1823 variable amplitude design curve
is similar to the periodically overstrained cast 319 fatigue life curve.
The data from the previous figure was replotted with the inclusion of
the base material "Fitted" Neuber Product reference curve and the same reference curve
with Yaxis terms divided by a factor 3; which amounts to a Kt=3 effect.
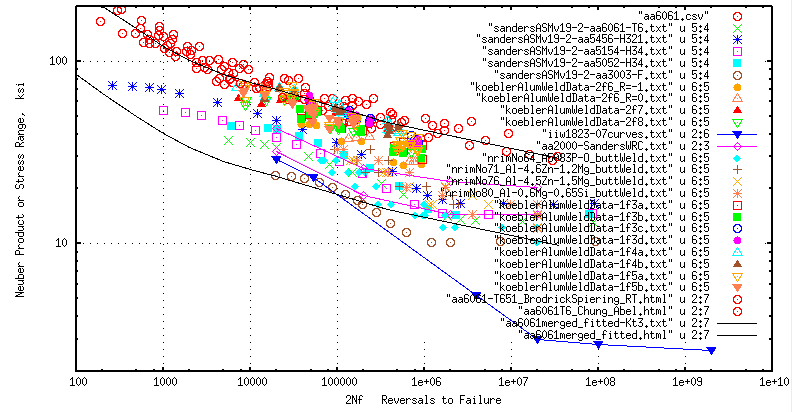
(Click image to enlarge)
Figure: Neuber plot of all found aluminum weld data along with un-notched
AA_6061 base material data and the Fitted base and Kt=3 tentative design curves.
Note that the "enlarged" version of the above figure shows the data after
removal of any load control test points that appear to have nominal plasticity.
With the assumption that the Leever method described above is suitable
for aluminum weldment fatigue life representations, one can create the
proposed Calculator
It consists of the
Fitted base metal calculator with the setting
of the elastic magnification factor to a value of 3 to reflect
a Kt=3. This magnification can be changed at the discretion of the user.