Doing a Quick Fatigue Analysis?

Author:FAConle Updated: Apr12 2012, Jun.2014

Introduction

This very short outline gives an overview of how fatigue analysis
is done in the ground vehicle industry.
NOTE: This is ONLY a rough guide. Use at your own risk.
If its important consult an expert.


There are three things you need to get to solve the problem:
  1. Material (fatigue data)
  2. Geometry of component
  3. Load on component

Material

Get: Name, Heat treatment, Hardness, Yield, Ultimate.

Is it aluminum? What type? (e.g.: AA 2024-T4) What heat treat (i.e. T6 etc).

If its a steel what is the Carbon wt%, heat treatment, hardness or ultimate tensile strength.

Go to into a database for materials and find the your material.


 Example db 

If no exact match exists you can try something similar for a rough guess at
a prediction. Match the carbon level, and hardness/Ultimate for steel.
Many steels for example, if of medium carbon (about 0.40 to 0.55 wt.%), can be
"represented" by an SAE1045 of similar hardness or ultimate tensile strength.
If you want best possible answer get the material fatigue tested (ASTM E606).

Geometry

What is the geometry of your part? i.e. How do the loads that are applied
"pass through" the component? Where is the critical failure location and
what is the elastic stress at that location?

E.g.: for a simple gear (Sprocket? :) the tooth may break, or something at the
shaft attachment. Lets assume we are looking at the tooth. It can
be analyzed as a cantilever beam. Apply a Unit Load of some sort (eg. 1000 lbs)
at the contact point. Find the elastic stress at the tooth root. Use text
books, Peterson's Stress Concentration factors or FEA analysis.
Elastic analysis is fine. Note that a gear tooth can also get hit from
"behind" -as you back-up a hill, or engine break etc. These reversed loads
have a huge influence on the critical fatigue "cycle".

Loads

Estimate or measure the loads you are going to apply to the
component. Specifically the loads that you considered in the
Geometry section above. The gear tooth load, for example, arises from a
torque on the gear. The gear is rotating at a certain RPM. You can
calculate how often a tooth gets hit at each torque level. It has been
done for the complete torque history of a vehicle on the proving grounds
for each tooth of a gear, but this takes some effort. One could
do a worst case analysis. Note that reversed loading is very
important. A material "remembers" a hit in one direction, and then
"links-up" with a hit in the opposite direction. A simple gear
tooth at constant torque would perhaps see a tooth root stress
as A, B, C below
         A            B            C  (tension)
        ^            ^            ^
       / \          / \          / \
      /   \        /   \        /   \
 0___/     \______/     \______/     \_____  ______        _____> t
                                                   \      /
                                                    \    /
                                                     \  /
                                                      \/
                                                       D  (compression)

A back-up load (D) would cause a compressive stress at the hot-spot.
This compressive stress actually would link-up with the largest of
A, B, or C to form the largest cycle. Thus lets assume that
load A is slightly bigger than B or C (non-constant torque on gear)
Then the above load history would be counted as

    cycle:     Max= A   Min=D    number= 1
    cycle:     Max= B   Min=0    number= 2    (assuming B=C)

 
This is called "Cycle Counting". The best automated way is to use the
Rainflow cycle counting program. -if you have a long messy (variable amplitude)
history. The best easy way to understand the counting method is to watch the
stress-strain behaviour of a fatigue test, but if that is not possible, try
the description of the "Reservoir Method" given in the British Standards.
It can be applied "by hand" to short load histories.

Analysis

Without getting into a whole lot of detail, once you have estimated the
elastic hot-spot Stress (at the tooth root of the sprocket, for example)
for your unit load of X newtons (or lbs, or whatever) then ratio your cycle
history Max, Mins according to the actual load history. Plug these stresses
into one of the "Calculators"


                 example for SAE4130 

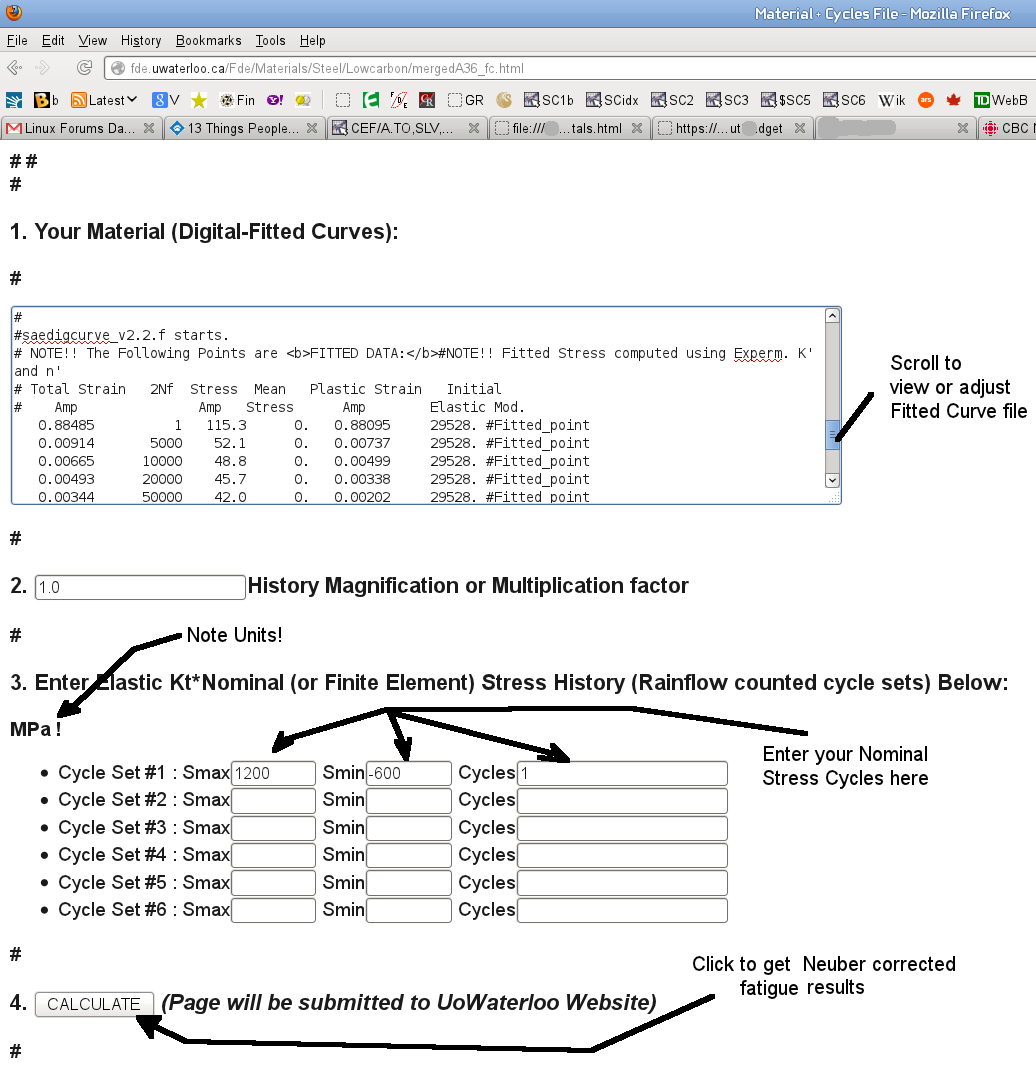
in the material database and click "Calculate button.
(Note: remove the example elastic stresses entered on the page and put in your own)

Many of the entries in the material data base have three items for each material:

  1. Raw test data
  2. Fitted curve (sort of a least sq. fit to raw)
  3. Calculator (uses the Fitted to calculate life) Screen shot

Calculate will bring back a page that has a table at the top that looks like this:


#xcalc2 Loop   Smax    Smin         N  Sigmax  Sigmin Delta Epsmax Epsmin DeltaEps  %Eps %SWaT %Sts %Morr %Goodm 
#xcalc2    1  1200.0  -600.0        1.0   679.  -550. 1229. 0.00962 -.00234 0.01196  99.1  95.1  99.1  98.0  96.6
#xcalc2    2   600.0  -100.0       20.0   475.  -214.  689. 0.00403 0.00081 0.00323   0.9   4.9   0.9   2.0   3.4

#xcalc3  StrainLife_Reps SWaT_Life_Reps StressLife_Reps   Morrow_Reps   Goodman_Reps (Reps= Repetions)
#xcalc3      3664.3          2829.9          3664.3          2076.4          1517.0


     Smax, Smin and N    are what you put into the table for calculation.

     Sigmax, Sigmin, Delta, Epsmax, Epsmin, DeltaEps are the hysteresis loop tips
           shown in the first graph below the table.

    %Eps, %SWat %Sts %Morr %Goodm    are the fatigue damage percentage
           that each of the entered cycle sets caused (hopefully).
           (some folks have their favorites).

    StrainLife_Reps, .... etc  are the number of times that your entered history
           can be repeated before predicted failure.


In my opinion if you have tensile mean stresses at your hot spot where
     Smean =(Smax-Smin)/2  
use the SmithWatsonTopper estimate SWaT_Life_Reps. If your mean is in
compression (negative) use the Morrow_Reps.

The graphs below the table are the stress-strain paths that your elastic
stresses caused at the critical hot spot. They are shown to give you an
idea of how much plasticity is going on. For more on how this is done see
the page on

    Plasticity Correction

The second graph is a plot of each of you cycle sets and re-ordered with
largest range(max-min) on the left and smallest on the right. Also shown is
how much damage each Rainflow counted cycle set has caused.

Thats it. Have fun.

Note that if you are designing something critical you should not rely on this rough outline without talking to an expert person.

More Detailed Analyses: