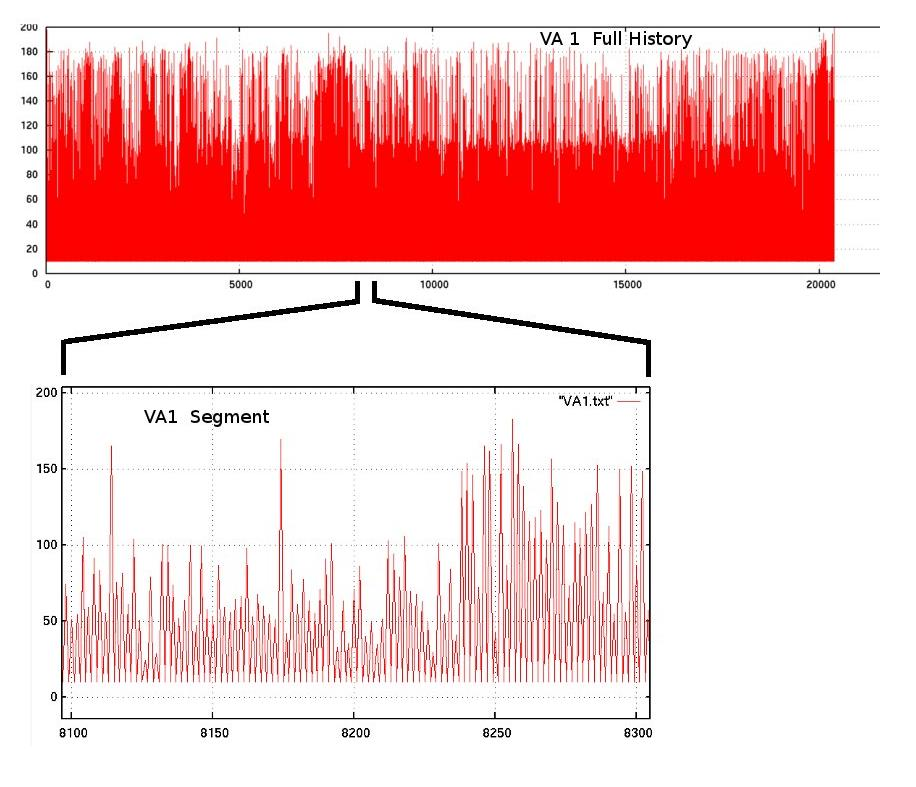
Fig. 3: Variable amplitude history VA1; max=200, min=10.07
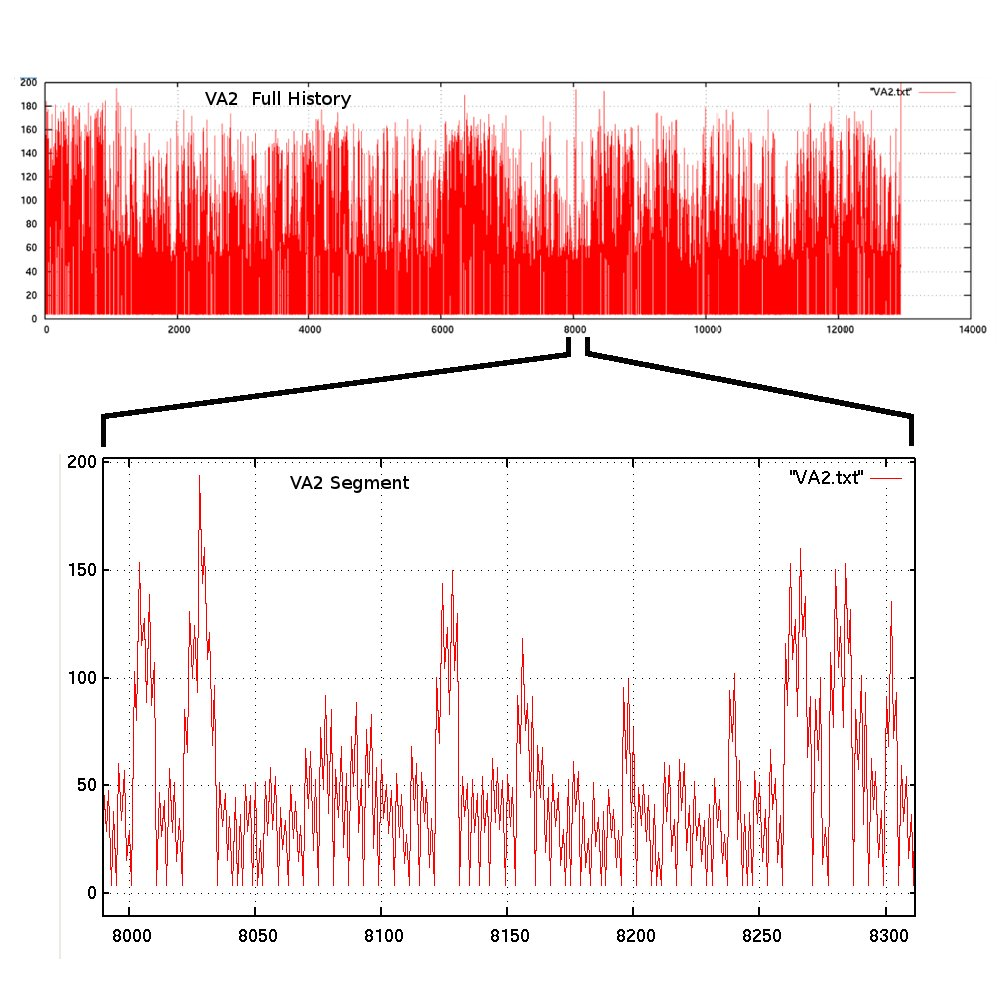
Fig. 4: Variable amplitude history VA2; max=200, min=3.94
Digital Versions of Test Histories:
      "... transverse stiffeners and laps, were welded to the plates using the
     flux-cored arc welding (FCAW) process with a nominal weld size of 6.4 mm (1/4 in.)"
CSA G40.21 350W is a higher manganese structural steel. The "350" denotes
Nominal Chem. for CSA G40.21 350W:
       (All elements are maximums allowed)

    0.23C wt%  0.4Si  0.50-1.50Mn  0.04P  0.05_S

Crack Initiation and Propagation data for a simulated HAZ are available

                          here

Baseline crack initiation and propagation specimens were machined from
plates that were subjected to a simulated Heat Affected Zone (HAZ) operation:
      1. Heat in furnace at 990 C  for 30min
      2. Cool between two contacting plates
      3. Machine specimens (see PhD thesis for details)
The process increased the hardness from HRB=89 to HRB=94.
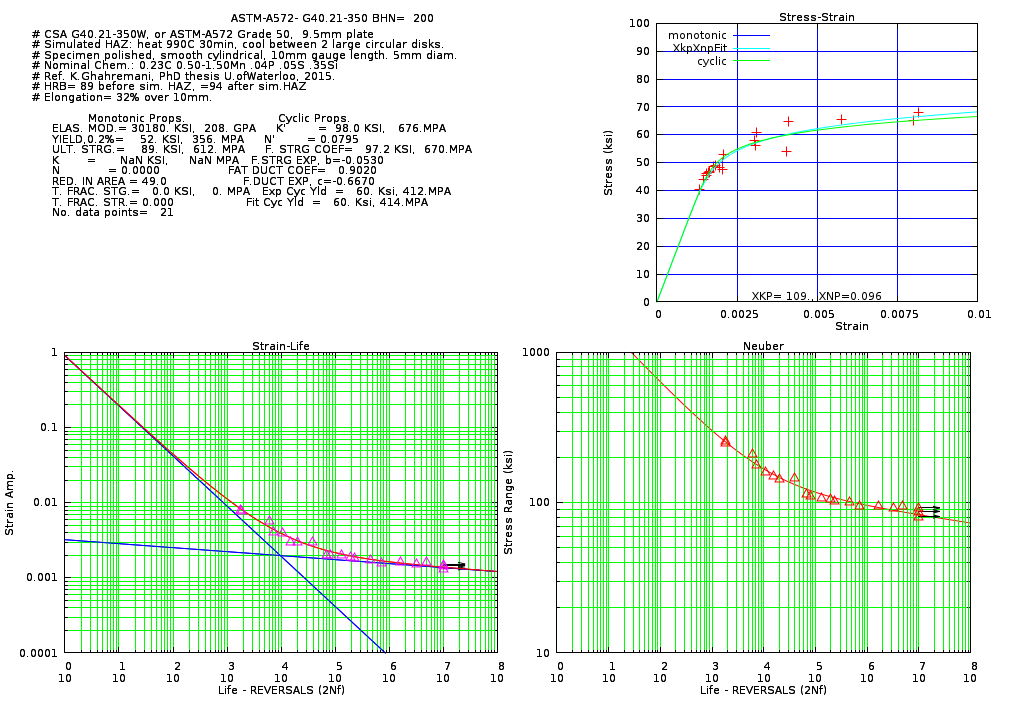
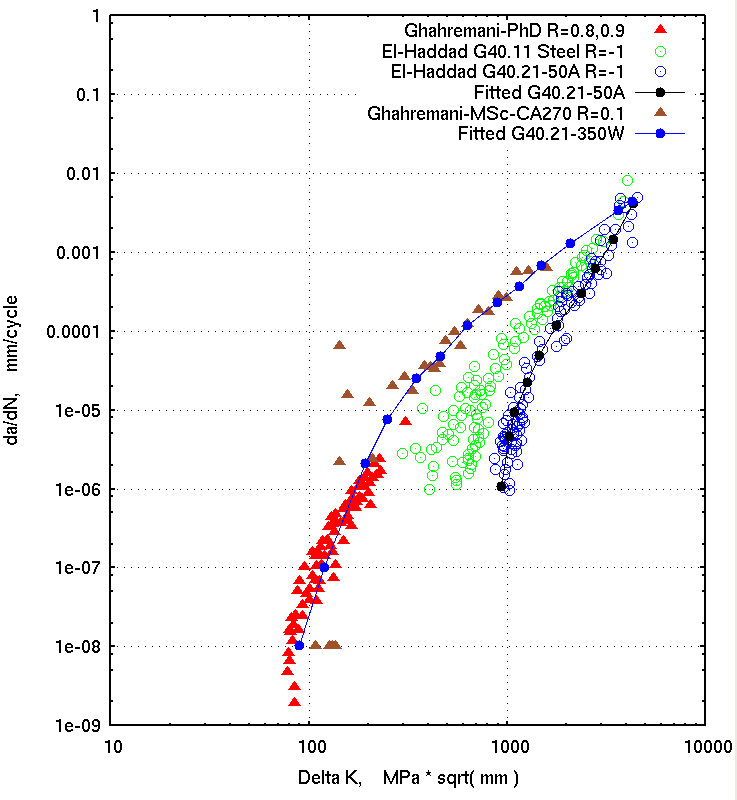
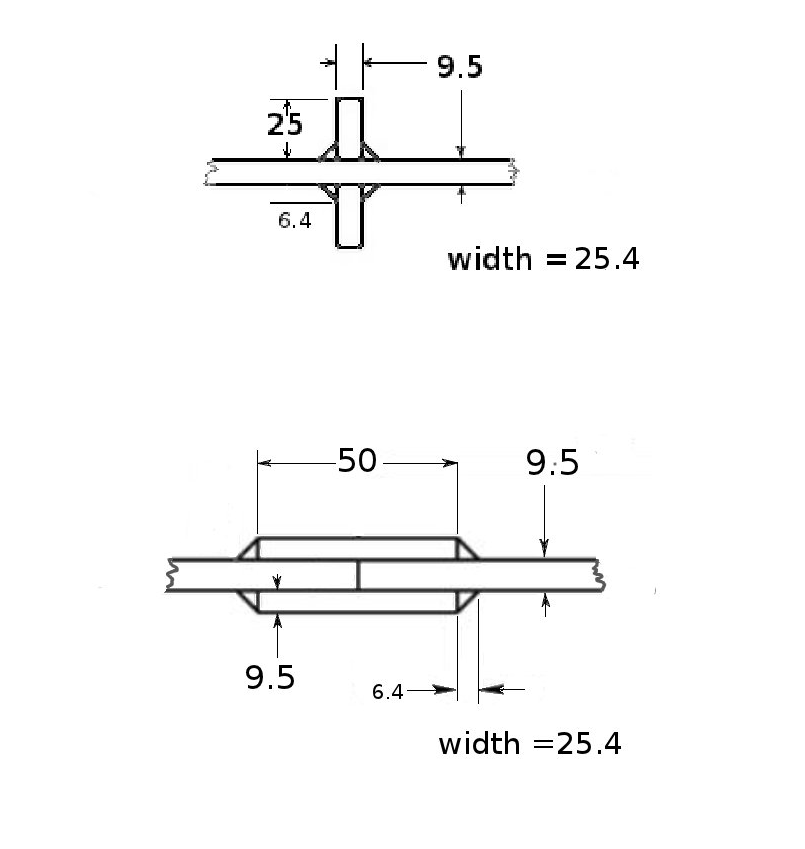
  Table 1      Condition:  As-Welded

          Name        Nf     Smax mpa       Smin mpa
          ----   ---------    -----          -----

          XCA-1    1995000     120             12
          XCA-2     920000     160             16

          LCA-1      27000     279             28
          LCA-2      17000     342             34
Two variable amplitude VA1 and VA2 histories were tested on several samples. Note that these histories have the same name as used in Ghahremani's MSc thesis, but are different histories in the PhD. The PhD histories were supplied by Ghahremani to the FD+E Comm. and are shown graphically in figures 3 and 4.
Fig. 3: Variable amplitude history VA1; max=200, min=10.07
Fig. 4: Variable amplitude history VA2; max=200, min=3.94
Digital Versions of Test Histories:
  Table 2  Condition:  As-Welded, X section (transv. stiffener)
                #Kasra Ghahremani  PhD

          Name        Nf     Smax mpa    Smin mpa  History
          ----   ---------    -----       -----      ----

         XAV1-1    3843000     180          10       VA1
         XAV1-3    1131000     229          12       VA1
         XAV1-3     713000     252          13       VA1
         XAV1-4     397000     387          21       VA1

         XAV2-1    8203000     167           7       VA2
         XAV2-3    1921000     226           9       VA2
         XAV2-3    1041000     319          13       VA2
         XAV2-4     827000     387          16       VA2

  Table 2  Condition:  As-Welded, L section (double lap)
                #Kasra Ghahremani  PhD

          Name        Nf     Smax mpa    Smin mpa  History
          ----   ---------    -----       -----     ----

         LAV1-1     652000     148           8       VA1
         LAV1-2    1080000     159           8       VA1
         LAV1-3    1651000     161           9       VA1
         LAV1-4     468000     180          10       VA1
         LAV1-5      56000     387          21       VA1

         LAV2-1    9840000     136           6       VA2
         LAV2-2     964000     179           7       VA2
         LAV2-3     116000     387          16       VA2