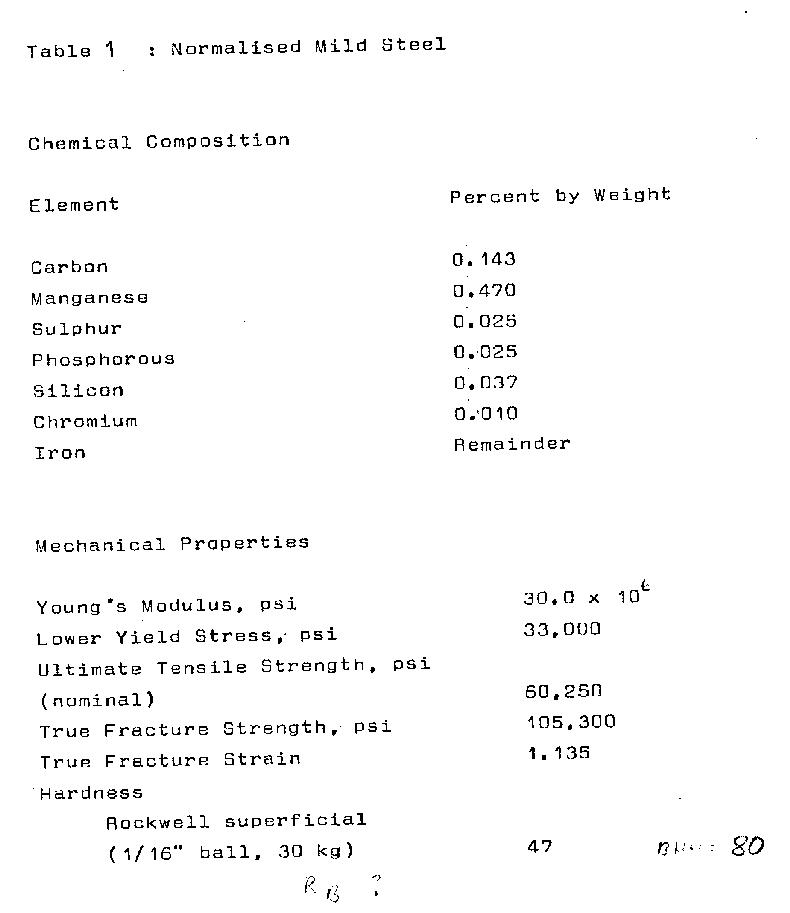
The present test series was directly related to the third area; the tests were supervised by H.R.Jhansale, but it is thought that the data presented shall also be of some use to the other two fields of investigation.
Previous work on the same subject for different materials can be found in References [5] and [6]; the test program being partially modeled on the work of Ref.[5].
Standard longitudinal specimens of 0.375" gage length and 0.250" diameter were tested in an MTS 20 kip closed loop servo controlled system as described in Ref. [8]. Conditioned output signals from load cell and clip - on extensometer were recorded by both X-Y plotter and high frequency response strip chart.
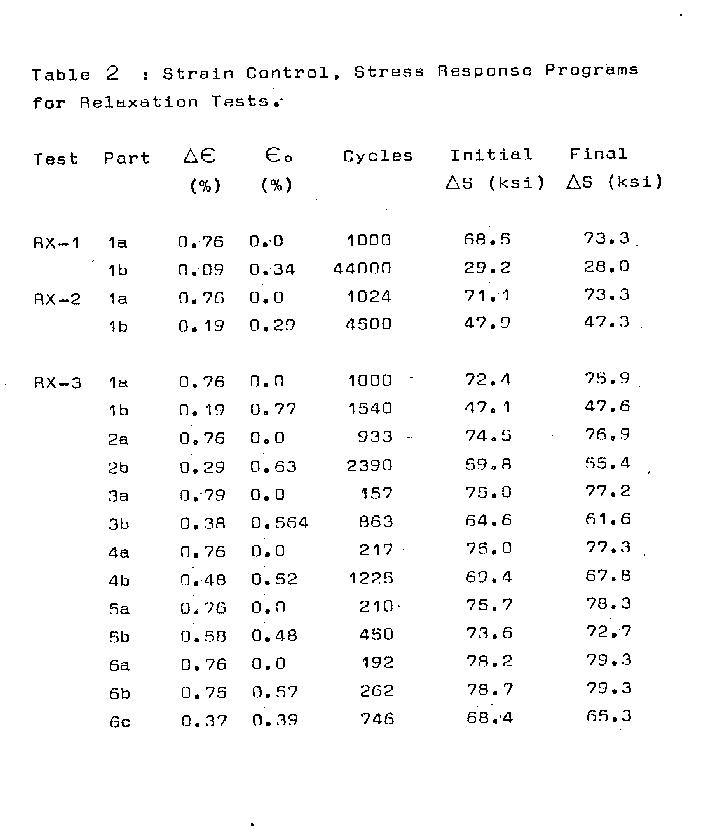
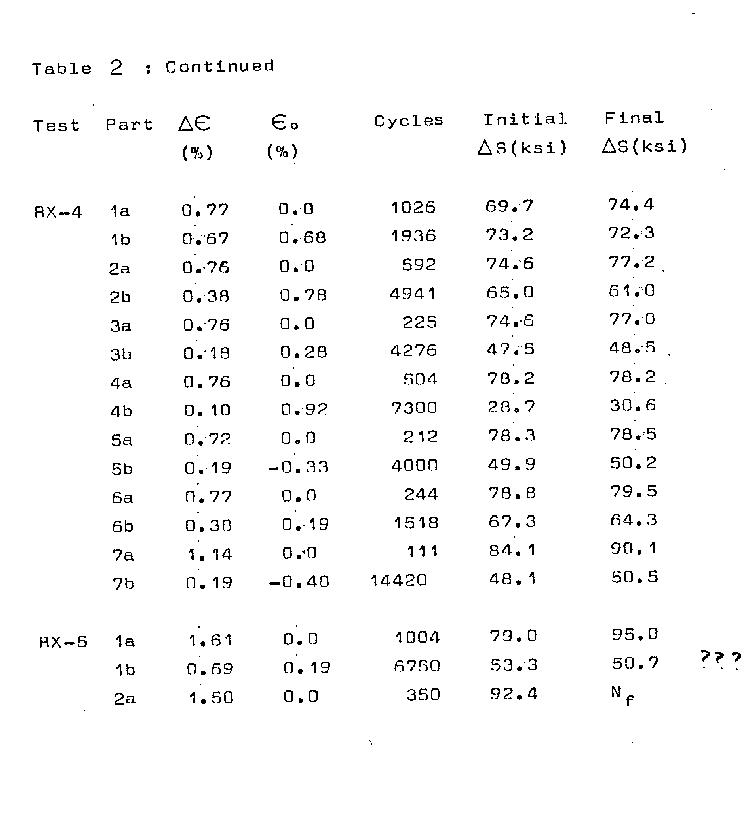
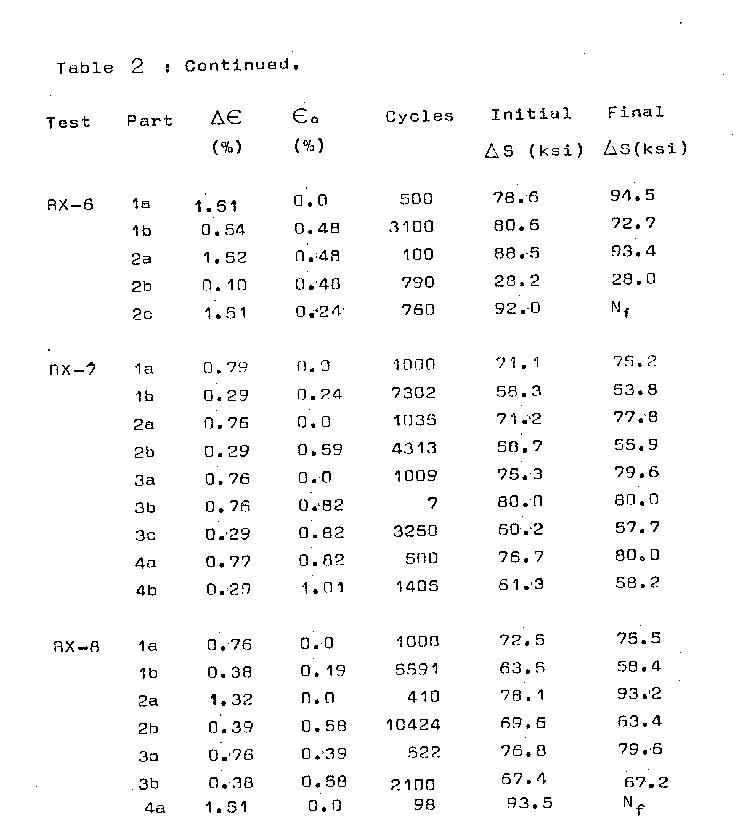
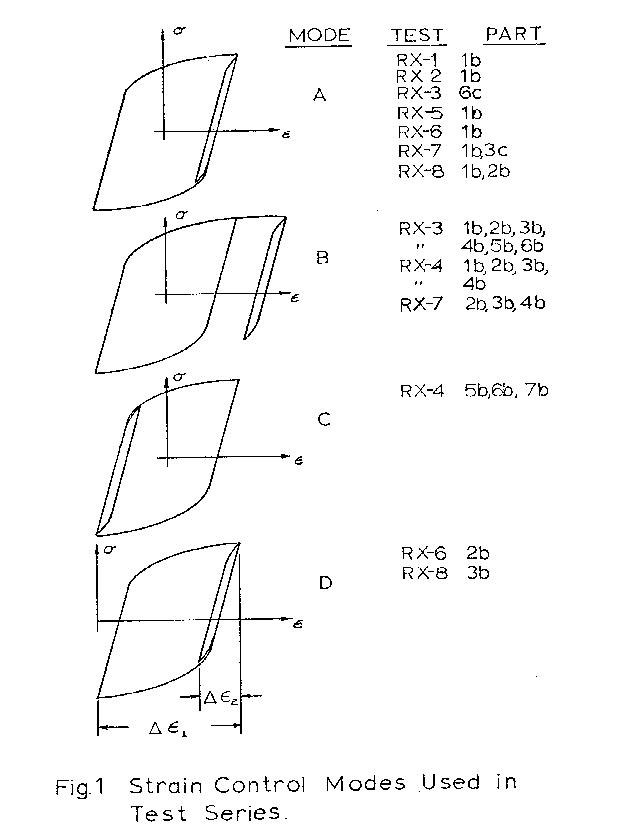
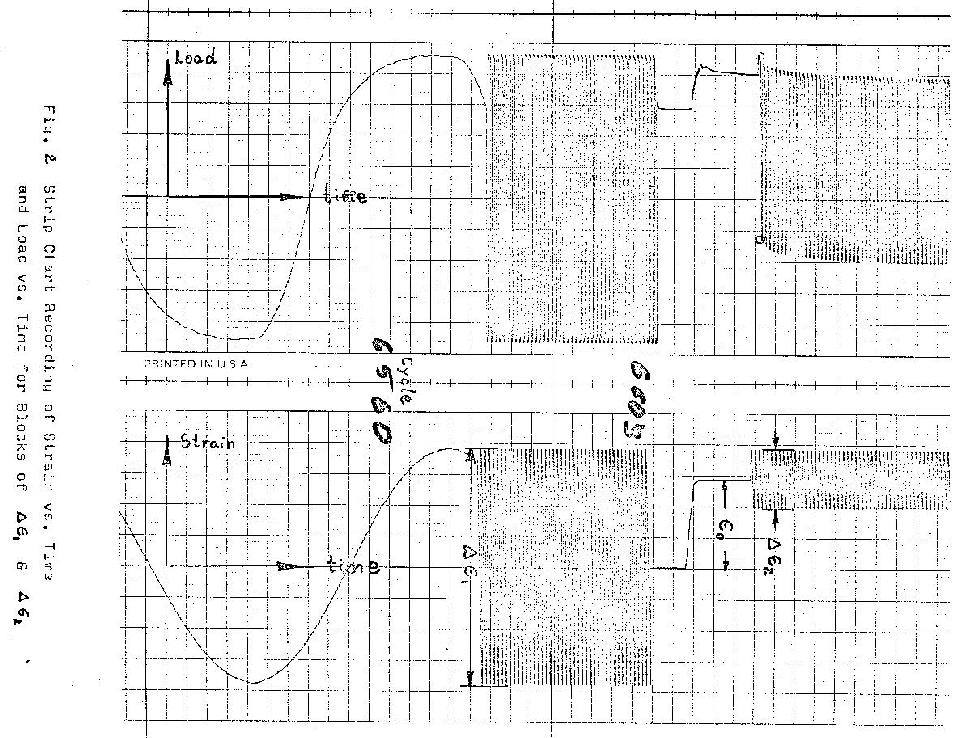
All eight specimens were subjected to strain controlled deformation programs; characterized by a block of cycles of large strain range ( Δε₁ ) followed by a secondary block at a smaller strain range ( Δε₂ ) which "relaxed" the mean stress induced by the chage in strain limits. Typical hysteretic control conditions for various parts of the test are shown in Fig._1 and a sample strain/time and load/time recording is given in Fig. 2.
The test program emphasized mean stress
relaxation behviour rather thatn the methods used to
induce it. For the normalized mild steel, which
displays hardening at high strain rages, and softening
in lower nonelastic regions, the relatively stable
strain range of Δε₁ = 0.77% was chosen for the "primary
cycling block" of six of the specimens, so as
to minimize hardening and softening effects on mean
stress relaxation. Two other tests, as listed in
Table 2 were conducted at the primary range of Δε₁=1.6%.
Secondary strain ranges varied from Δε₂=0.10%
to Δε₂=0.67%. In most tests the application of the
first two blocks of mean stress inducing ( labeled as 1a
for all tests), and means stress relaxing (block type 1b)
was followed by others at different ranges.
The notation used to denote primary blocks is as:
Part 1a, 2a, 3a ...etc.,
while secondary relaxation blocks are labeled:
Part 1b, 2b, 3b, ...etc.
Mean stress was taken as the average between
upper and lower stress limits for every second half
cycle and recorded as "mean stress per cycle".
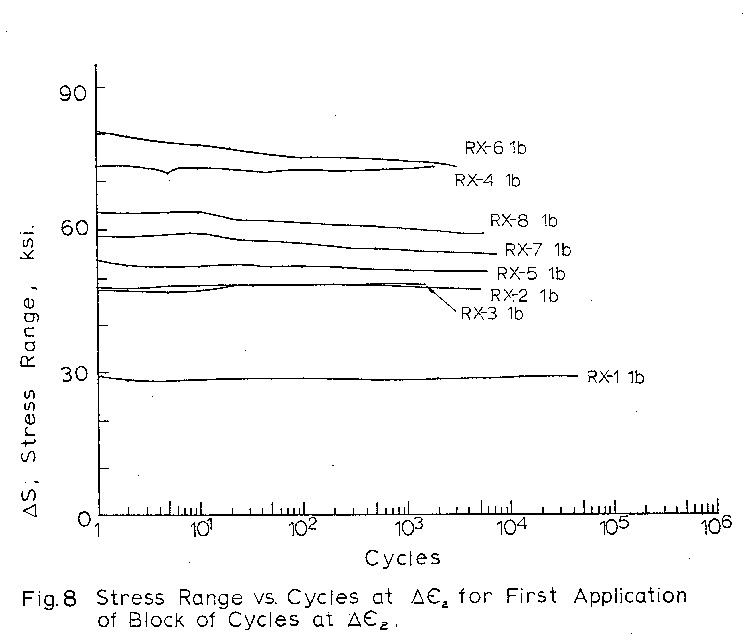
Hardening and softening, taken as the change in stress
range were also recorded.
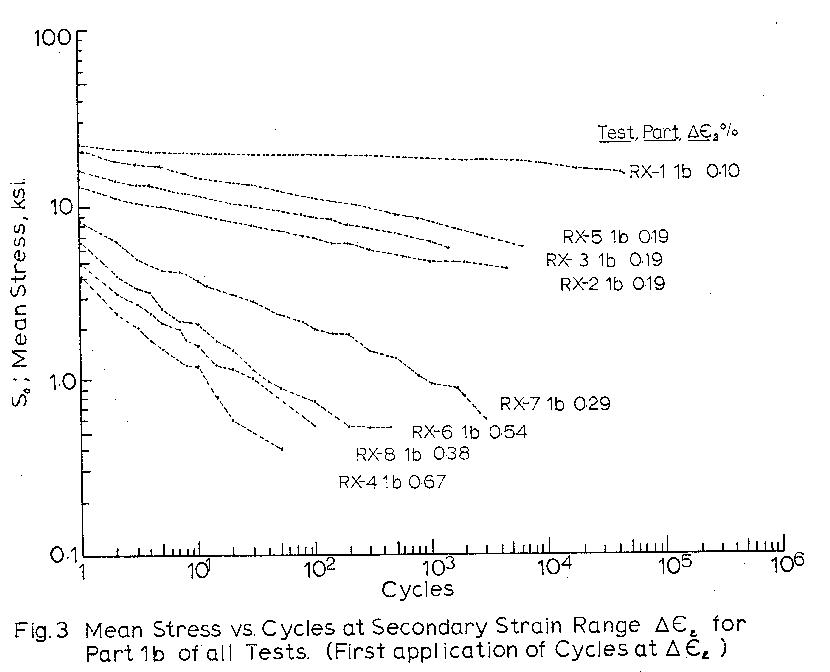
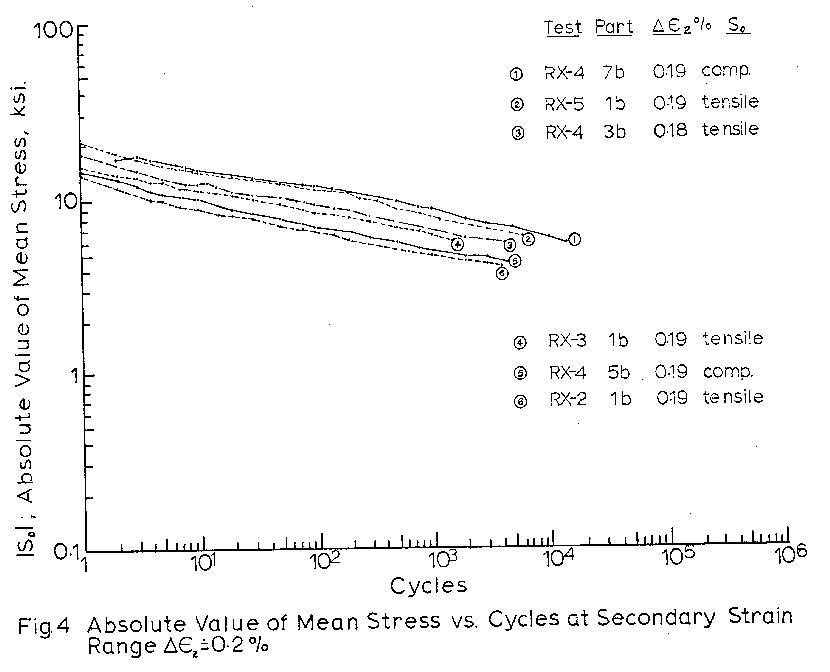
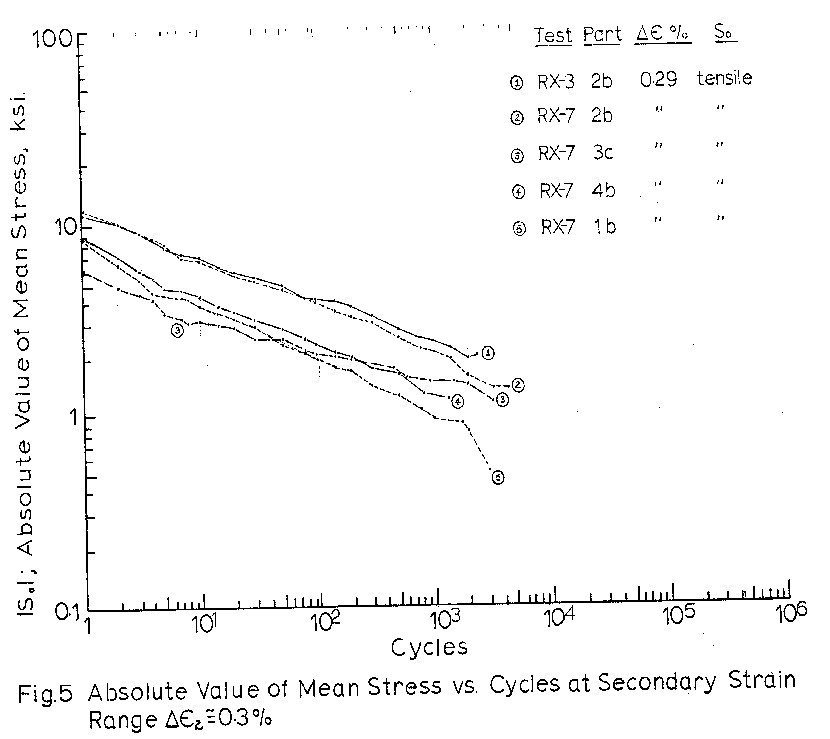
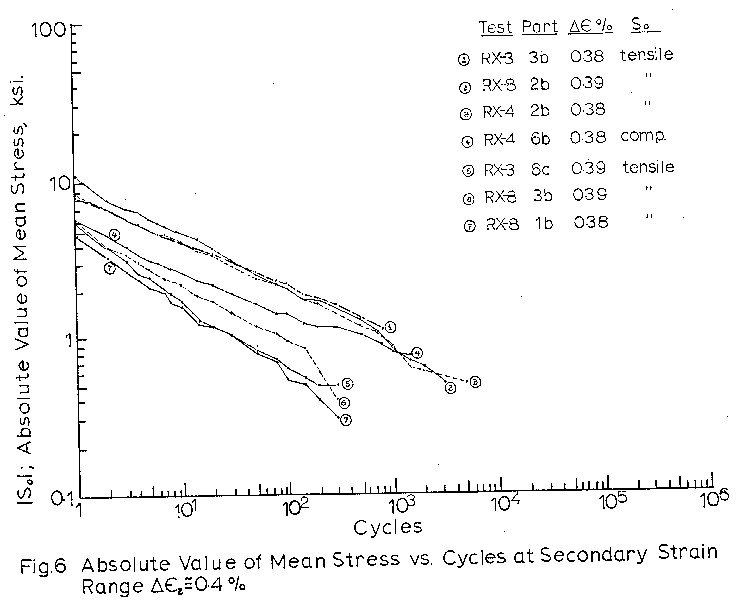
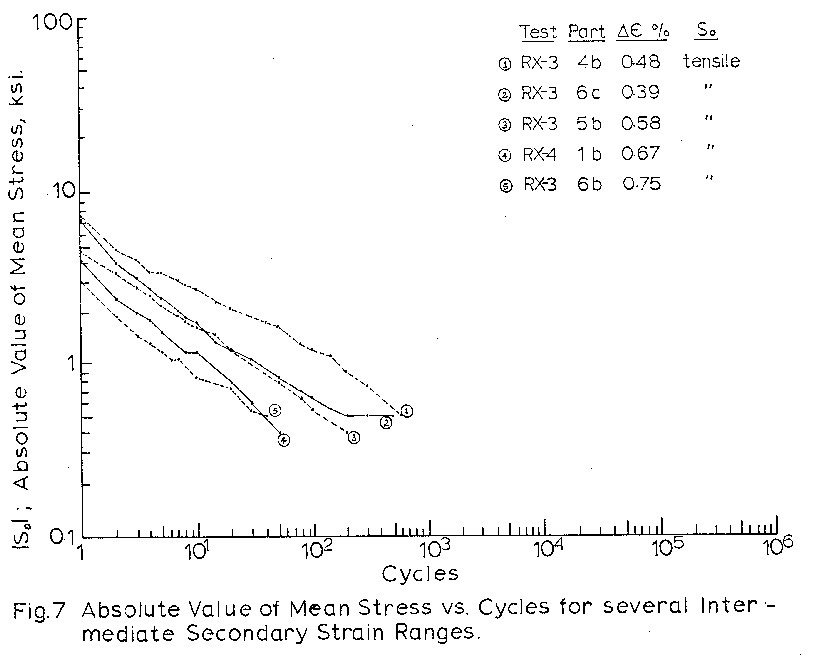
Figures 4 to 7 indicate that mean stress relaxation
as a function of cycles can be expressed as
           So = C x Nb

where  So is the mean stress at cycle N
       C  is the mean stress at cycle 1.
       b  is the slope of So vs. N on the log-log graph.
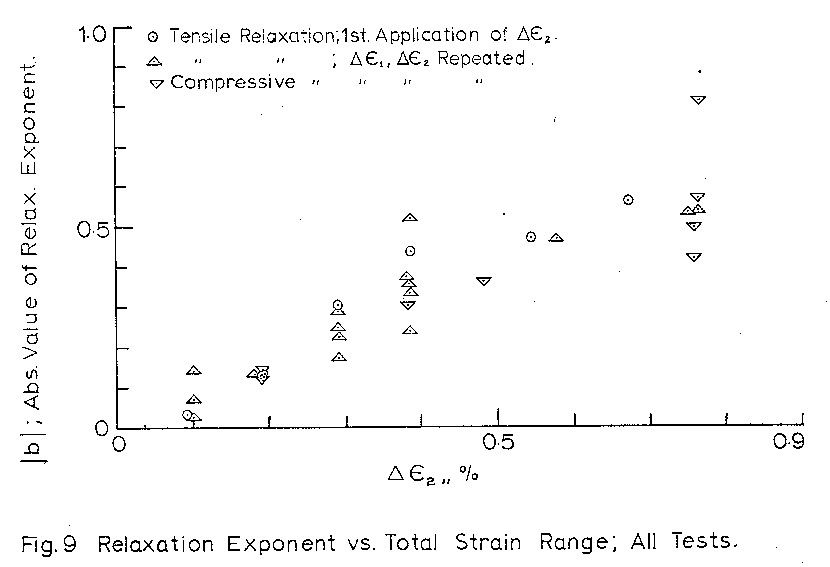
The exponents for all blocks with mean stress
relaxation are plotted vs. total strain range and
plastic strain range in Figs. 9 and 10 respectively.
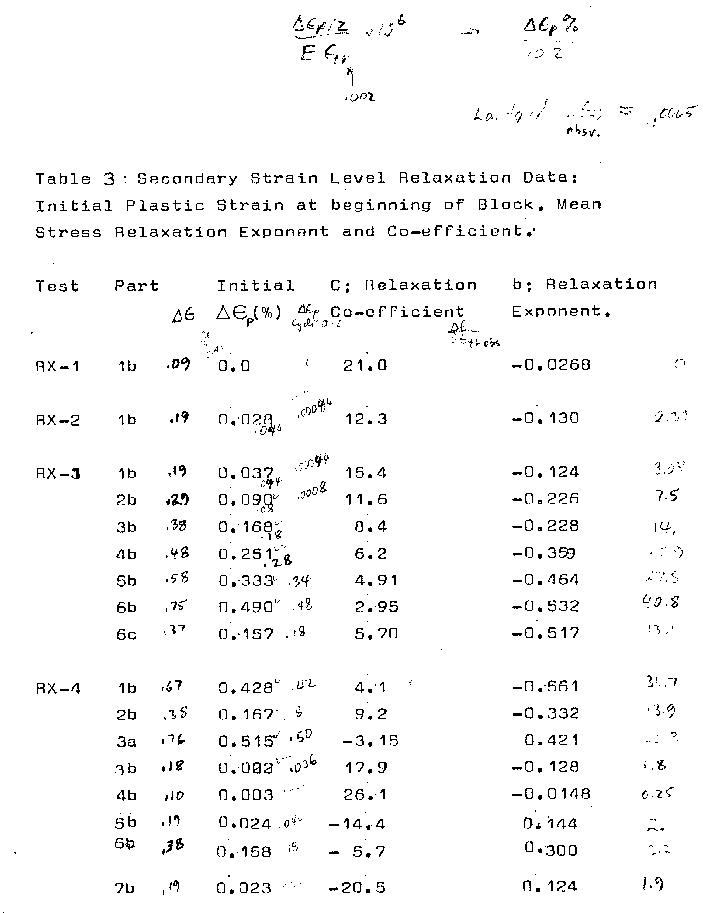
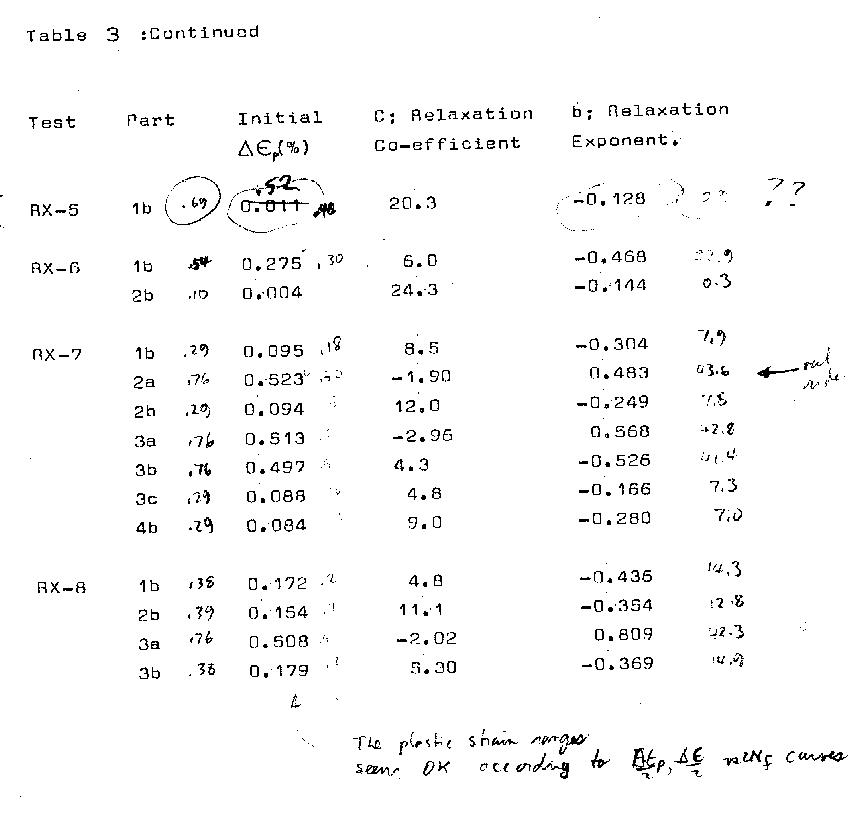
The co-efficient appears to be related to the
loop shape of the primary strain limits and the
relative poition of the secondary strain limits.
So = C x Nb
The co-efficient, C is a function of the
relative poitiions of primary and secondary strain
ranges.
The exponent b, is believed to be related to
the plastic strain occurring in the secondary
block; as indicated by the trends in Figs._9 and_10.
Significant scatter is also evident in these figures;
specifically the exponents for tests RX-3 6c, and
RX-8_3a. Table 2 indicates that these recordings
were made fairly late in the life of the specimens
and it is possible that the presence of a crack has
affected the behaviour. This however cannot be the
only reason for the scatter as other tests at similar
lives still conform to the power relationship, without
the variation in exponents.
The effects of superimposed hardening or
softening behariour on mean stress relaxation are
difficult to interpret from present data. By
saturation of the material with 500 to 1000 cycles at an
intermediate strain range, it was hoped that large
changes in stress range with cycling, would not occur.
Table 2 indicates however that the mean stresses
were at times accompanied by some softening. One
possible way for cyclic hardening of softening, defined
as a change in stress range, to show up as
an apparent mean stress relaxation, is for the material
to become anisotropic with deformation. i.e. The
stress range in the tensile half cycle is always larger
or smaller than the stress range in the compressive
half cycle which immediately follows it. This would
result in a movement of the hysteresis loop along its
mean strain axis with cycling. Definite conclusions as
to this inter-relationship can however not be made
fro the results of the present study and further
research is warranted.


