Fig. 3: Variable amplitude history ps-m40; Smax=300, Smin=30 mpa
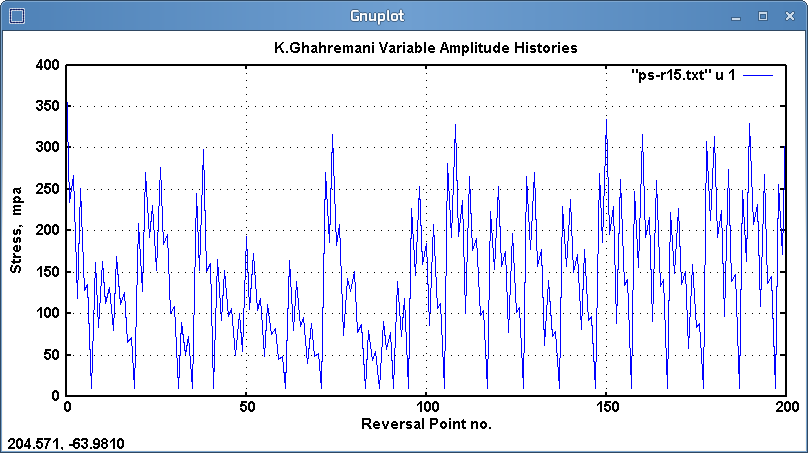
Fig. 4: Variable amplitude history ps-r15; Smax=380, Smin=10 mpa
Digital Versions of Test Histories:
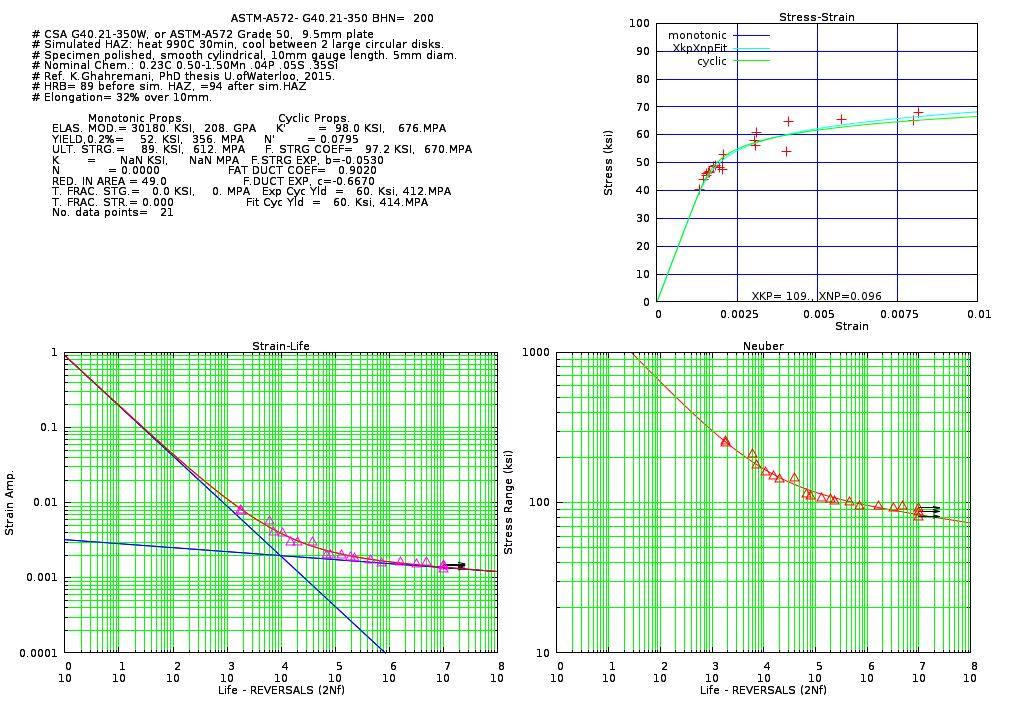
Nominal Chem. for CSA 350W:

       All elements are maximums allowed:

        0.23C wt% 0.4Si  0.50-1.50Mn  0.04P 0.05S

Crack Initiation and Propagation data for a simulated HAZ exist

                          here
Constant amplitude plus underload (CA+UL)tests consisted of blocks of 1000 cycles, where
an underload (R=-1) sub-block of 10 cycles was followed by 990 cycles at R=0.1 with
the same Smax as the underloads. Test specifics are shown in the "Results section below.
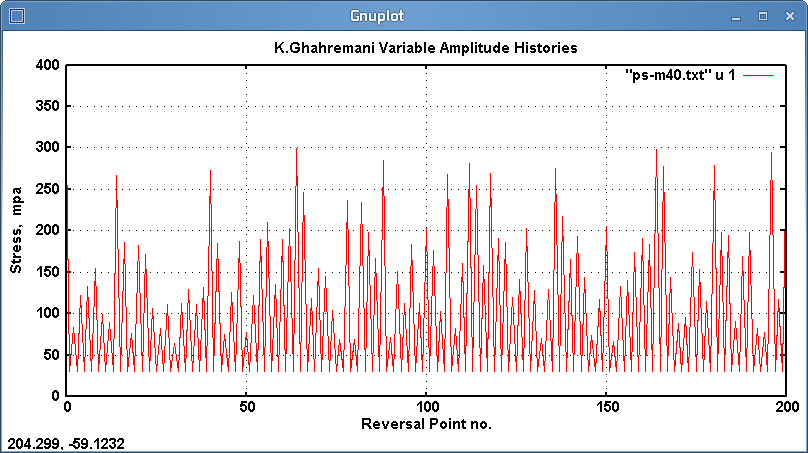
Two variable amplitude (VA) histories were applied to several samples. The histories,
supplied by Ghahremani[2] are shown graphically in figures 3 and 4.
Fig. 3: Variable amplitude history ps-m40; Smax=300, Smin=30 mpa
Fig. 4: Variable amplitude history ps-r15; Smax=380, Smin=10 mpa
Digital Versions of Test Histories:
                        Table 1
                #Kasra Ghahremani  MSc

    #CA tests,  As Welded
       #R= -1
       #  Nf   DeltaS  Smax  Smin
        33417   400.   200  -200       #R= -1  Wilson
        49568   400.   200  -200       #R= -1  Wilson
        53635   400.   200  -200       #R= -1  Wilson
       #R= 0.1
        54919   270.   300    30       #R= 0.1
        58036   270.   300    30       #R= 0.1
        69577   270.   300    30       #R= 0.1
       201741   180.   200    20       #R= 0.1
       382113   180.   200    20       #R= 0.1
       403798   180.   200    20       #R= 0.1
       #R= 0.4
       170953   180.   300   120        # R= 0.4
       180655   180.   300   120        # R= 0.4


    #POL tests and VA1 and VA2 tests
       # As Welded specimens. "L" implies Large sub-block
       # Small subblock has 990 cycles,  Large sub-block has 10 cycles
       #  Nf  sDeltaS sSmax sSmin  LSmax  LSmin
        52964   270    300    30   300    -300     #CA+UL
        60408   270    300    30   300    -300     #CA+UL
       210197   180    200    20   200    -200     #CA+UL
       275552   180    200    20   200    -200     #CA+UL
       #
    #Variable Amplitude Histories.
       #  Nf   equivDeltaS  Smax  Smin
       295579   161         380    10        #ps-r15
       345038   161         380    10        #ps-r15

       225492   159         300    30        #ps-m40
       331974   159         300    30        #ps-m40
       353163   159         300    30        #ps-m40


                              Table 2

       # Kasra Ghahremani MSc Thesis 2010.
       # Needle Peened tests

    #CA tests
       #R= -1
       #  Nf   DeltaS  Smax  Smin
        923988   400.   200  -200   #CA  R= -1    #runout
        924000   400   #CA  R= -1    #runout
       3096270   400  #CA  R= -1    #runout

       #R= 0.1
        172717   270    300    30   #CA  R= 0.1
        418576   270    300    30   #CA  R= 0.1
        592659   270    300    30   #CA  R= 0.1
        688696   270    300    30   #CA  R= 0.1

       3394070   180    200    20   #CA  R= 0.1  #runout
       3615600   180    200    20   #CA  R= 0.1  #runout
       3912960   180    200    20   #CA  R= 0.1  #runout

       #R= 0.4
       1627410   180    300   120   #CA  R= 0.4
       1747370   180    300   120   #CA  R= 0.4
       1832230   180    300   120   #CA  R= 0.4

    #POL tests and VA1 and VA2 tests
       #  "L" implies Large sub-block
       # Small subblock has 990 cycles,  Large sub-block has 10 cycles
       #  Nf  sDeltaS sSmax sSmin  LSmax  LSmin
        111632   270    300    30   300    -300   #CA+UL
        308927   270    300    30   300    -300   #CA+UL
        480343   180    200    20   200    -200   #CA+UL
        269589   180    200    20   200    -200   #CA+UL   runout
        298244   180    200    20   200    -200   #CA+UL   runout

    #Variable Amplitude Histories.
       #  Nf   equivDeltaS  Smax  Smin
       1638690   161         380    10   #ps-r15
       2889630   161         380    10   #ps-r15   runout
       3375430   161         380    10   #ps-r15   runout

       3454800   159         300    30    #ps-m40   runout
       4130840   159         300    30    #ps-m40   runout
       5055650   159         300    30    #ps-m40   runout