The overload is typically in excess of 1/2 of the material yield strength, and is usually taken off of a constant amplitude strain-life curve as the strain amplitude at 10000 cycles to failure. The overload is typically fully reversed.
The smaller cycles share the same maximum or peak value as the overload.
The overloads drive down the crack opening stress to below that of the minimum of the small amplitude cycles, and thus the small cycles grow free of crack closure.
Using the Palmgren-Miner linear damage rule one can remove the damage resulting
from the overloads and calculate the "equivalent" lives of the the small
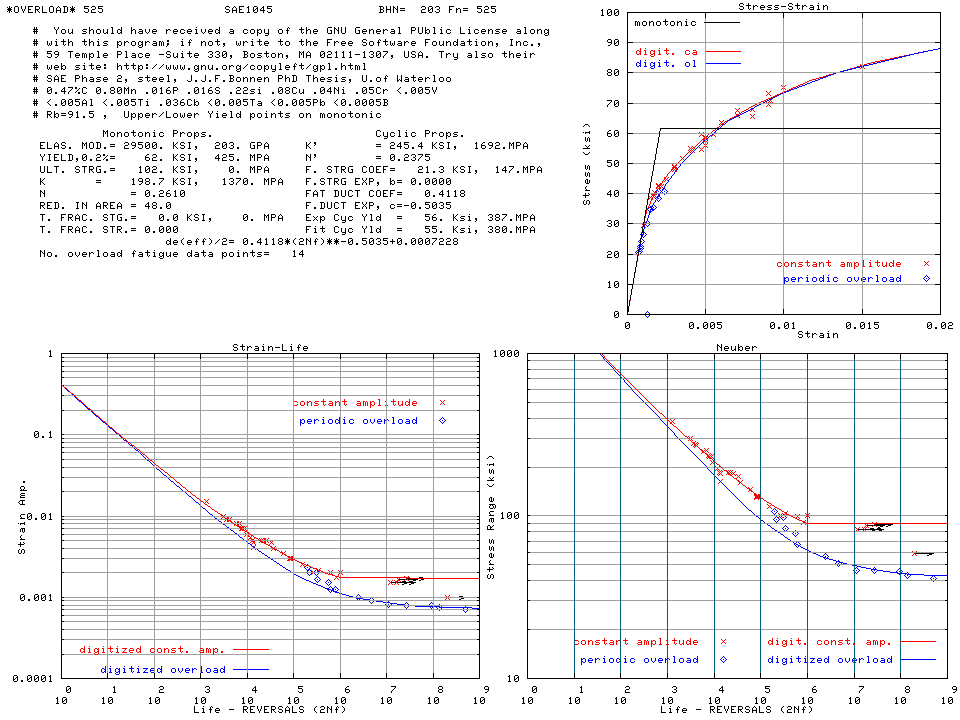
cycles. Thus this graph was born:
The net result is the blue curve in the figure. It represents the most conservative possible fatigue curve for design purposes because it allows the fastest possible crack growth for a given strain amplitude and thus results in the shortest possible lives. Note: not only have lives been shortened but the fatigue limit has been substantially reduced (by over 1/2) compared to the standard constant amplitude design curve (red).
These sorts of curves are most useful in the design of components subjected to variable amplitude loading environments (chassis, suspension, etc.) where it may only occasionally see very large excursions but numerous smaller loads that, because of the presence of the larger load, may contribute significant damage that was previously (and dangerously) ignored by traditional analytical methods.
References (very incomplete):