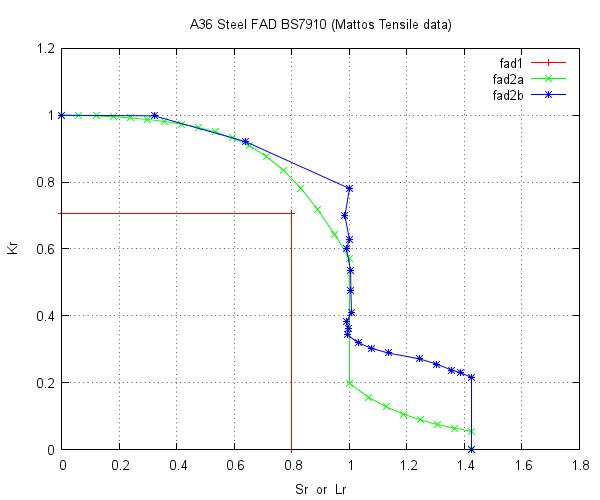
The purpose of a FAD Failure Analysis Diagram is to check if the progress of
a propagating crack will endanger the component for plastic collapse/fracture.
Details of the process can be found in British Standard BS7910 : 2005 Section 7 pg.23.
A brief statement of the Failure Analysis Diagram found there is:
       "The vertical axis of the FAD is a ratio of the applied conditions, in
        fracture mechanics terms, to the conditions required to cause fracture,
        measured in the same terms.  The horizontal axis is the ratio of the
        applied load to that required to cause plastic collapse."
Example Diagram:
Example Tensile test input file:
a36_Mattos_mono_engrSS_FLAT.txt
Program to compute points in FAD table:
getFADs.f (click on RAW button to download)
Program usage: ./getFADs fadsTableFile
Resulting FAD table:
x65_aune_FADs.table.txt
Script to plot FAD table:
plotFADs (Linux bash script for gnuplot)
Script usage: ./plotFADs fadsTableFile