Click for larger version
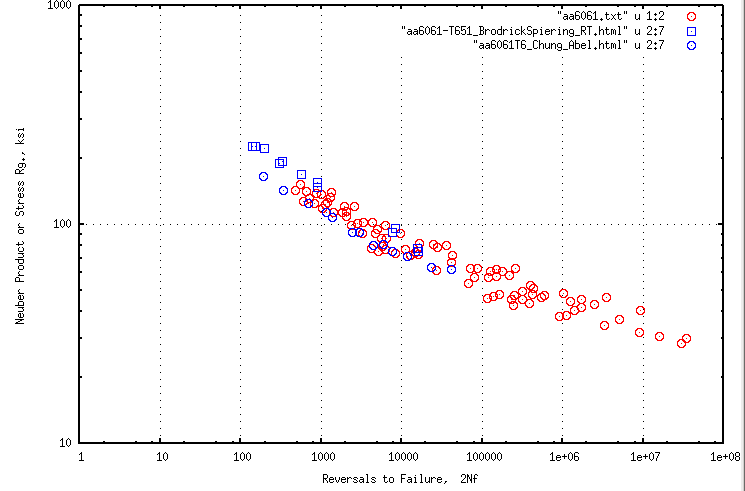
The two data sets published by [1] Brodrick and Spiering and by
[2] Chung and Abel only encompass a fatigue life span of about
100 to 50000. reversals to failure. In order to create a
resonably reliable fitted curve that extends to 10**7 reversals
it was necessary to add other data. Little published data exists
in the open literature for AA 6061 material (If you know of some
send me an email at gmail.com). The data of [1] and [2] however does
extend to levels of low plasticity, as can be seen in the Cyclic
stress-strain plots of the two individual files. It therefore
becomes possible to use the Neuber plot from:
F.A. Conle, "Accounting for Scatter in Strain-Life Fatigue Testing," SAE Paper 2002-01-1279
for AA6061. That Neuber stress plot, as re-digitize and then combined
with the data from [1] and [2] leads to the following plot: