saefcalc2.f vers.= 1.9
Simulation input data:
Material file= merged_a36_fitted.html
Multiplication Factor= 0.5400000E+01
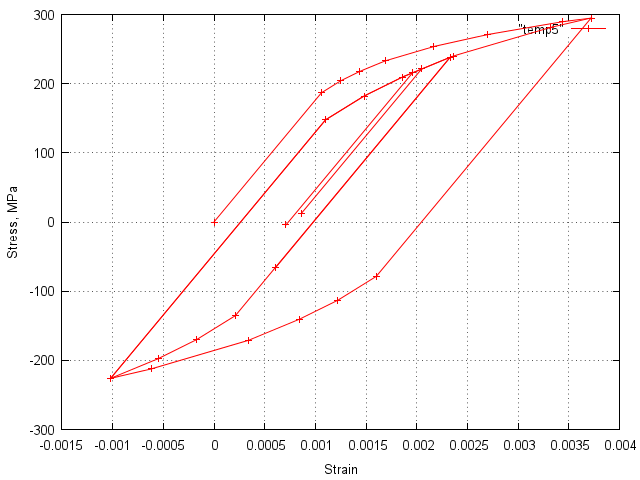
Loop   Smax    Smin         N  Sigmax  Sigmin Delta Epsmax Epsmin DeltaEps  %Eps %SWaT %Sts %Morr %Goodm
1   472.5  -236.5        1.0   295.  -226.  521. 0.00372 -.00102 0.00474  77.5  79.6  77.5  83.5  86.8
2   326.2  -236.5        1.0   238.  -226.  464. 0.00233 -.00102 0.00335  22.5  18.4  22.5  16.5  13.2
3   326.2    -0.2        1.0   238.   -65.  304. 0.00233 0.00061 0.00172   0.0   2.0   0.0   0.0   0.0
4   281.3    44.8        2.0   216.    -4.  220. 0.00196 0.00071 0.00125   0.0   0.0   0.0   0.0   0.0
5   292.7    67.5        2.0   222.    12.  210. 0.00205 0.00086 0.00119   0.0   0.0   0.0   0.0   0.0
Predicted History Repetitions to Initiation:
StrainLife_Reps SWaT_Life_Reps StressLife_Reps   Morrow_Reps   Goodman_Reps (Reps= Repetions)
58607.6         44488.3         58607.5         39644.9         29902.1
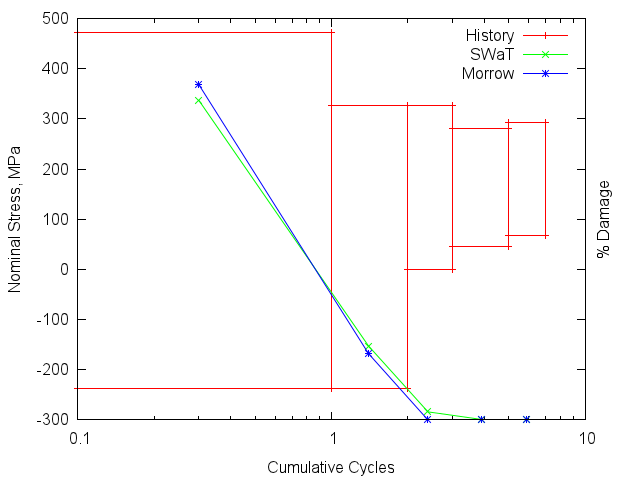
(Rectangles are Rainflow Cycle Sets: Sorted by Range: largest on Left)
#Inputs after scaling and sorting:
#  Srange    Smean     Cycles   Smax   Smin
709.0  118.0         1.0 472.5 -236.5
562.7   44.8         1.0 326.2 -236.5
326.3  163.0         1.0 326.2   -0.2
236.5  163.1         2.0 281.3   44.8
225.2  180.1         2.0 292.7   67.5
#SAE Standard Fatigue Data File format
#